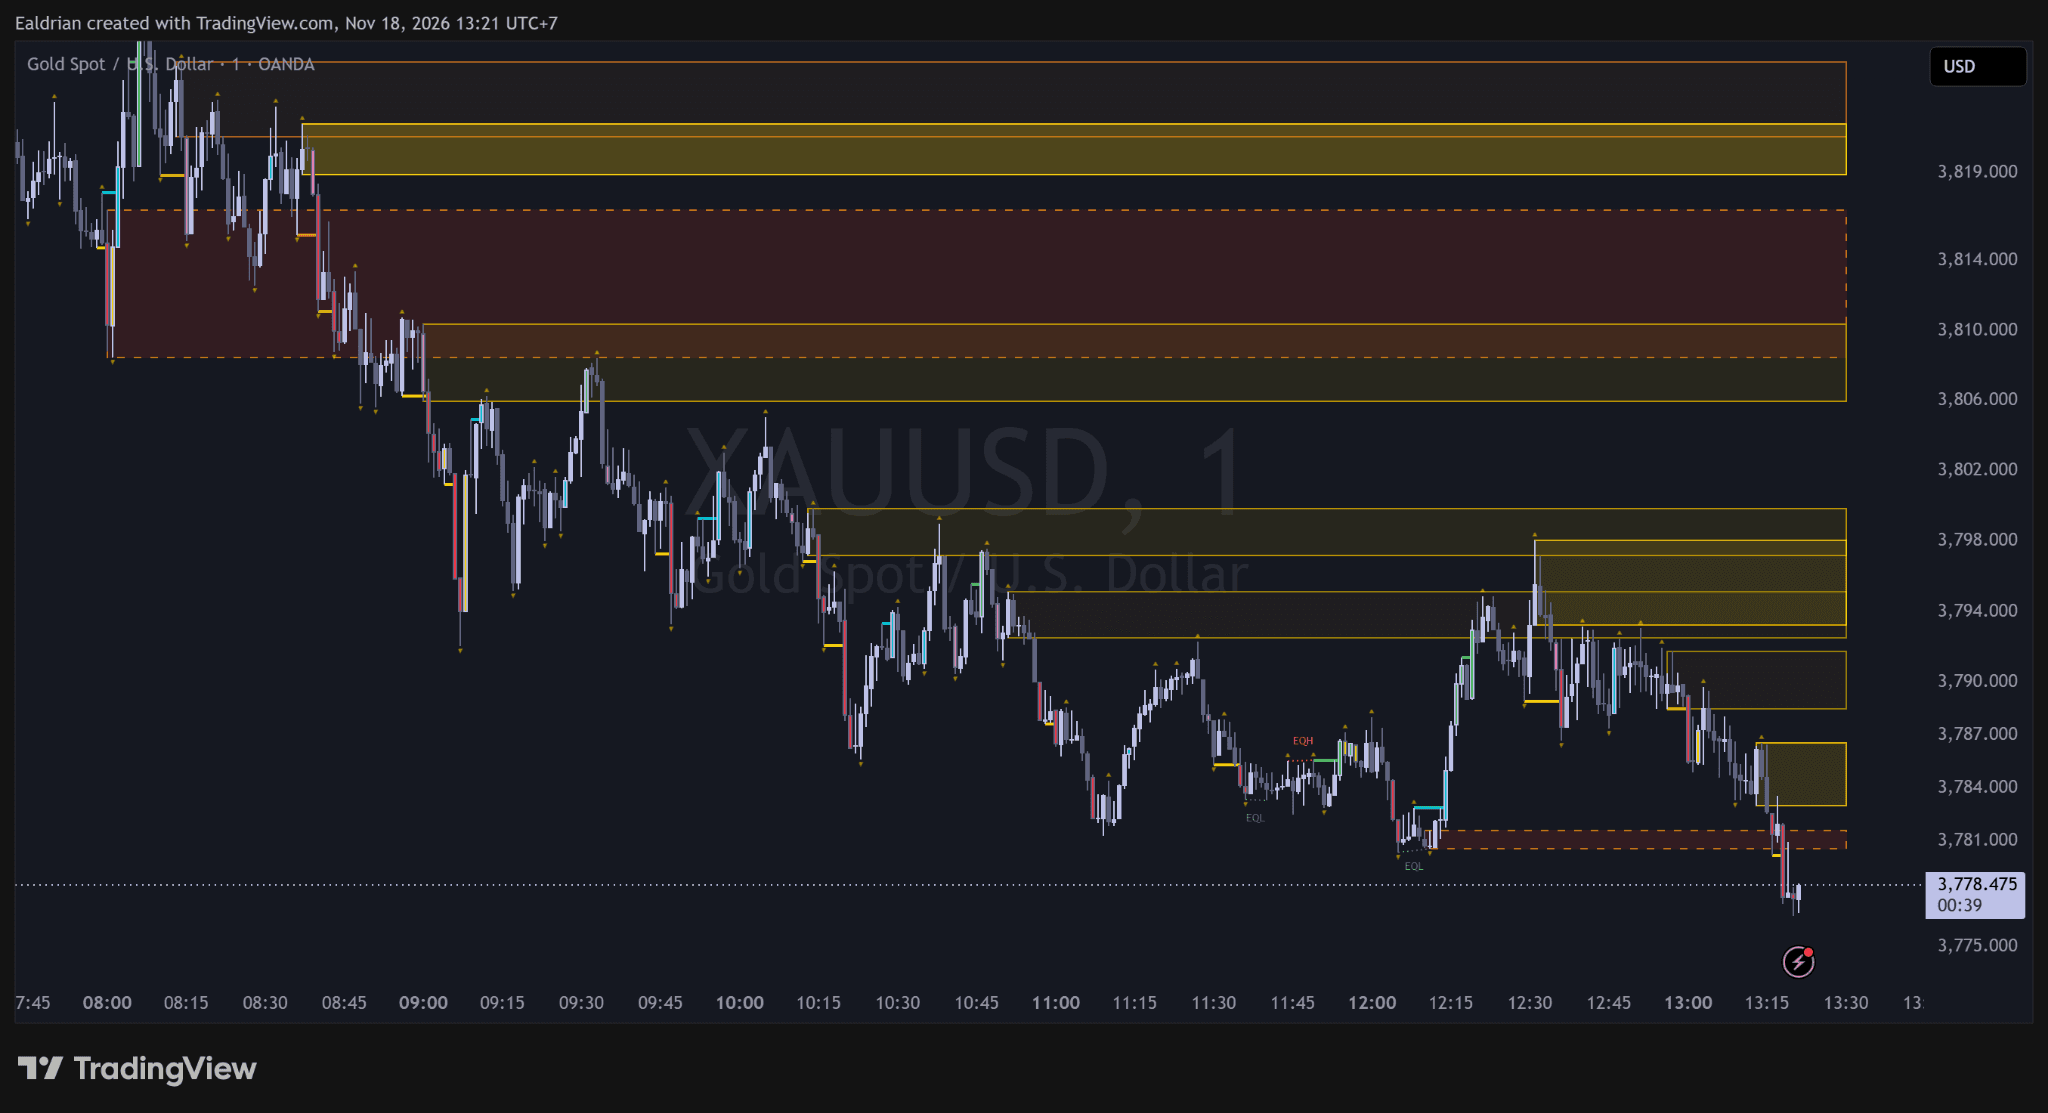
ORDER BLOCK INTELLIGENCE
Eduinfx OB Suite
Visualize Supply & Demand zones, multi-timeframe order blocks, nested areas, and market-structure confirmations.
Supply & DemandHTF / LTF Order BlocksNested OBCHOCH / BOS

Account-specific MT5 analytics. Estimated cumulative balance growth; not independently verified returns.
Compounded from approximate monthly balance returns; not verified TWR or historical equity.
View full performance →USC and USD are never combined. Past performance does not guarantee future results. Source warnings and calculation methodology should be reviewed before relying on these figures.
Explore Eduinfx tools on TradingView. Invite-only access inquiries are handled through Telegram.
Visualize Supply & Demand zones, multi-timeframe order blocks, nested areas, and market-structure confirmations.
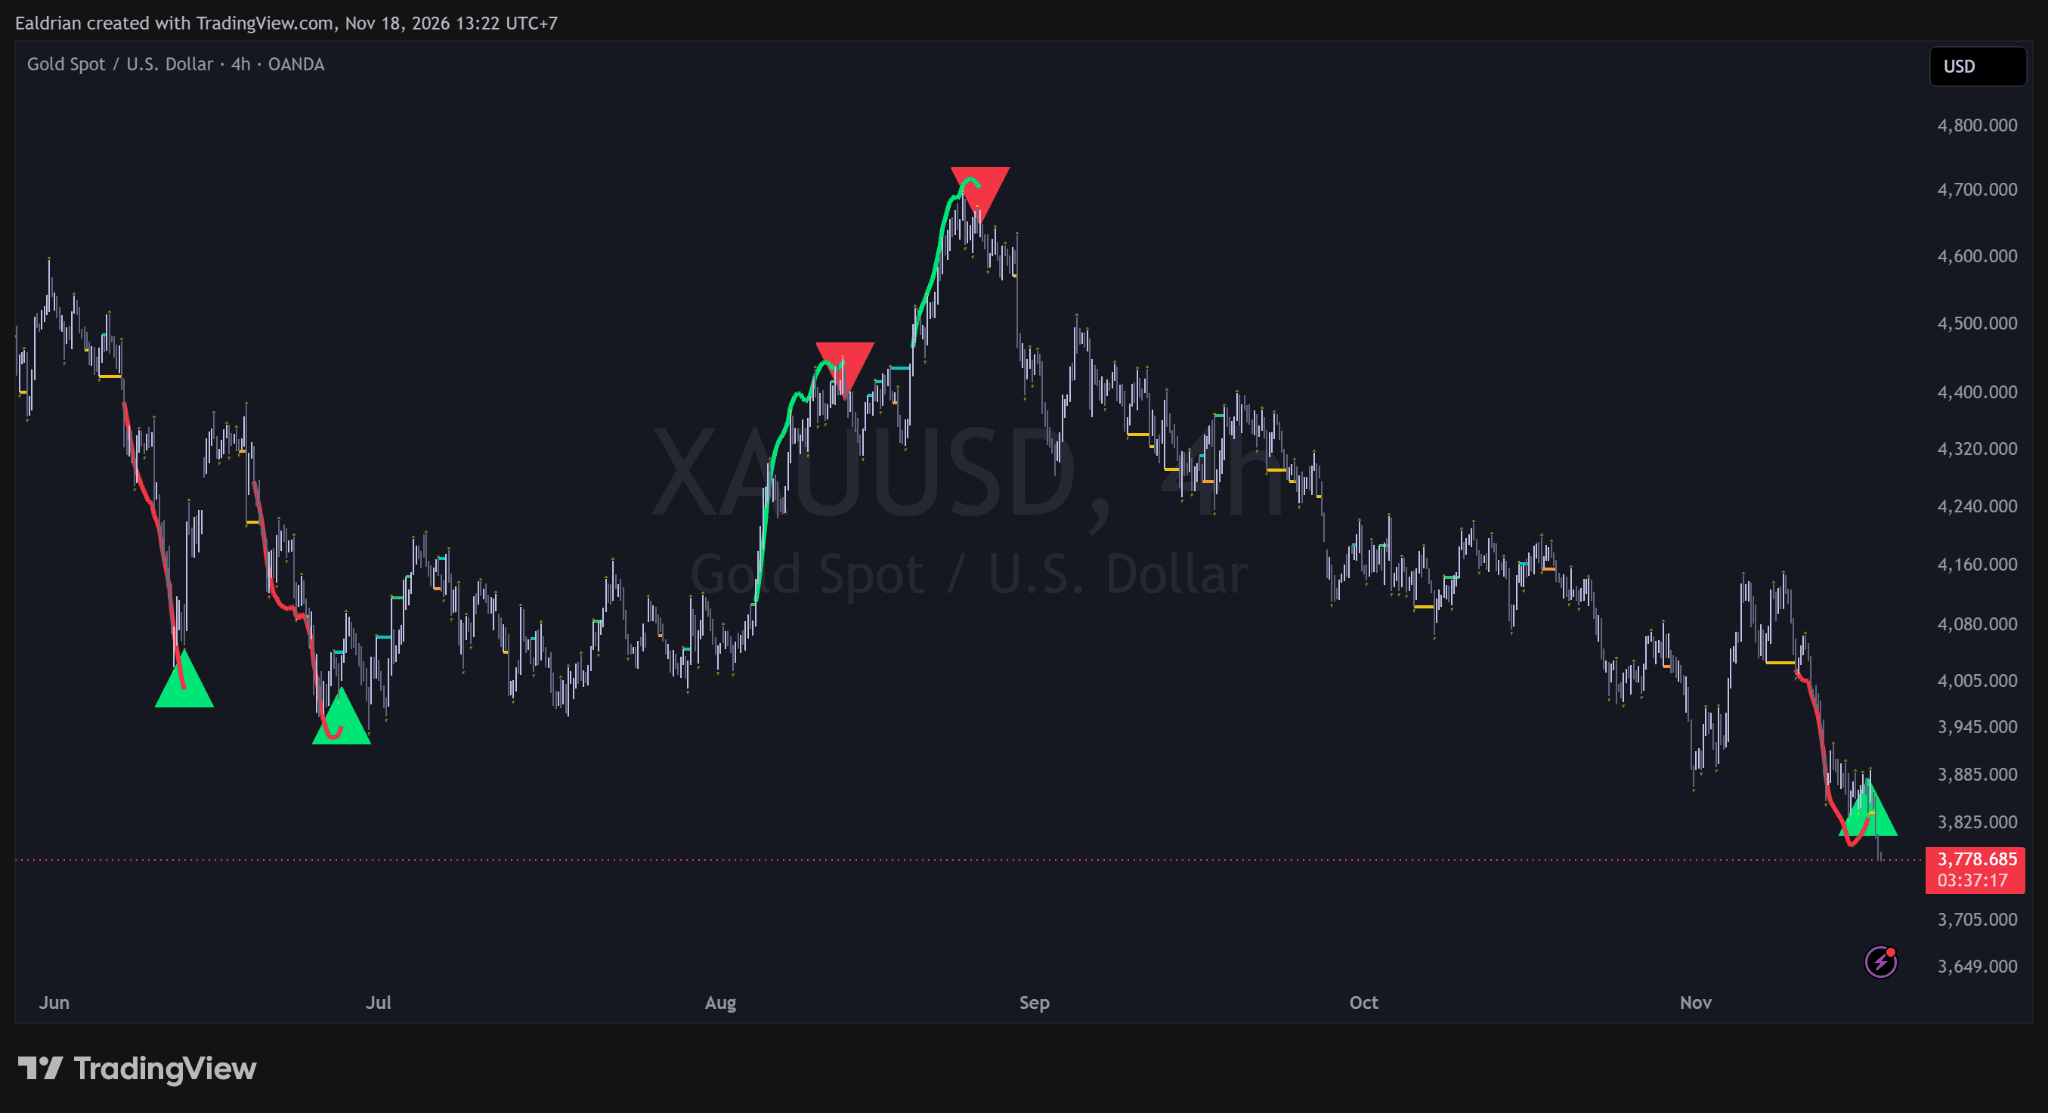
Read Bollinger Band riding momentum and potential directional changes using chart highlights and directional markers.
Trading indicators are analytical tools, not guarantees of outcomes. Trading involves risk.
EDUINFX · XAUUSD
15 articles · Showing 6
Selama sesi trading sebelumnya, perpotongan garis Tenkan dan Kijun, yang ditandai dengan kotak berwarna merah muda, diamati pada grafik XAUUSD. Sinyal ini menunjukkan potensi perubahan dalam tren ke bawah.
Read Article →Harga telah jatuh di bawah fraktal bawah pada grafik. Ini mendefinisikan ruang fase sebagai selatan. Dengan demikian, skenario yang paling mungkin untuk perubahan harga adalah penurunannya. Untuk menilai prospek perkembangan pergerakan ini, dimensi pasar lainnya akan dianalisis.
Read Article →Meskipun terjadi penurunan harga yang stabil, grafik XAUUSD memberikan sinyal tentang kemungkinan selesainya momentum bearish saat ini.
Read Article →Dengan menganalisis sesi trading sebelumnya, ada baiknya memperhatikan perpotongan garis Tenkan dan Kijun, yang ditandai dengan kotak berwarna merah muda. Garis cepat Tenkan turun di bawah garis Kijun, yang biasanya menandakan perubahan tren ke arah bawah. Namun, kemudian harga naik di atas garis Tenkan, yang menunjukkan pelemahan dorongan ke bawah.
Read Article →Selama sesi trading sebelumnya, perpotongan garis Tenkan dan Kijun, yang ditandai dengan kotak berwarna merah muda, diamati pada grafik XAUUSD. Sinyal ini menunjukkan potensi perubahan dalam tren ke bawah.
Read Article →PP: 3667.72;S1: 3577.00; S2: 3529.04; S3: 3438.32;R1: 3715.68; R2: 3806.40; R3: 3854.36.
Read Article →